Pivot Table in Python – Blog

Pivot Table in Python

What is Pivot Table

Pivot Table is one of the most efficient functionalities which we generally used in the Microsoft Excel or Google Spreadsheet or any other similar program. Pivot Table is used for summarizing the data in various ways with respect to the attributes available in the data. You can also add some formulas and calculations to it.

Pivot Table in Excel

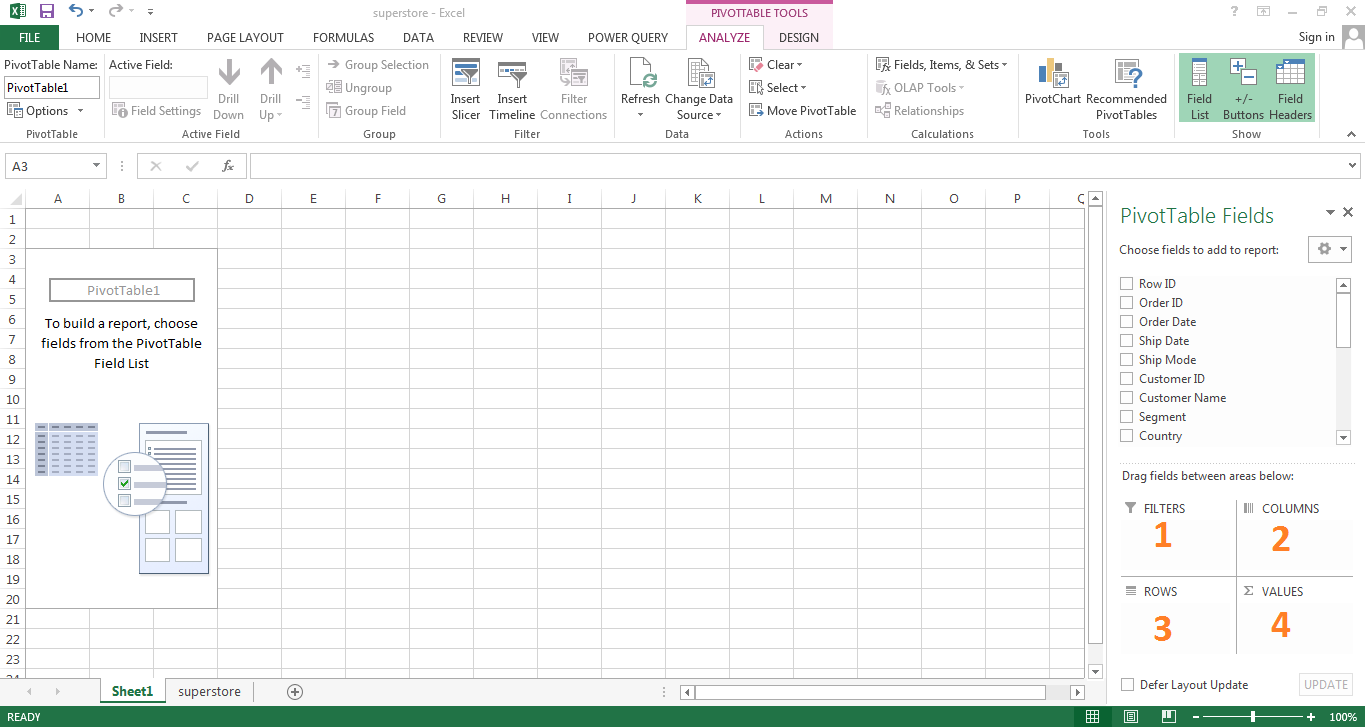
We are going to use Superstore Sales Dataset available in Kaggle. To get this dataset Click Here. If we use the pivot table in Excel, then It would look like below. It will have four fields to play with.

  1. Filters – Filter the data used in the other 3 fields
  2. Columns – Defining columns of summarized data
  3. Rows – Defining rows of summarized data
  4. Values – Summary Statistics like Sum, Count, Average, % etc.

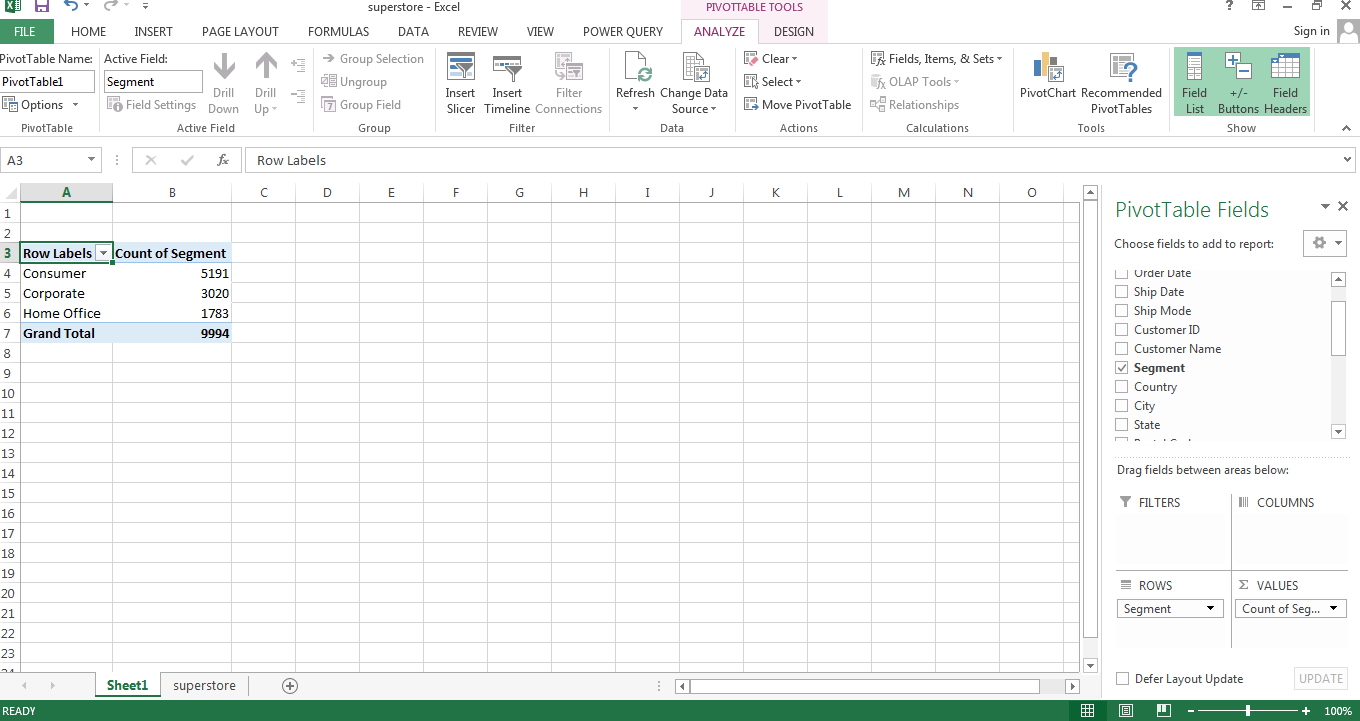
If we want to summarize Segments with its count, then we shall drag and drop the Segment field in Rows because we want to summarize the Segment field. We shall drag again Segment field to Values because we want counts in each segment. It is shown in the below image.

Pivot Table in Python

In python, Pivot table functionality is also available. It is in the Pandas library. It is the most efficient library developed for data manipulation and analysis on programming languages like Python. To know more about Pandas, Click Here.

We will also use Numpy library as it is the fundamental package for scientific computing with Python. It contains among other things:

  • a powerful N-dimensional array object
  • sophisticated (broadcasting) functions
  • tools for integrating C/C++ and Fortran code
  • useful linear algebra, Fourier transform, and random number capabilities
In [2]:
# Importing Library

import pandas as pd
import numpy as np
In [3]:
# Importing Dataset and store it in the object df

df = pd.read_csv("C:\\Users\\Neerav\\superstore.csv")
In [4]:
# Print first 5 rows of data

df.head()
Out[4]:
Row ID Order ID Order Date Ship Date Ship Mode Customer ID Customer Name Segment Country City Postal Code Region Product ID Category Sub-Category Product Name Sales Quantity Discount Profit
0 1 CA-2016-152156 08-11-16 11-11-16 Second Class CG-12520 Claire Gute Consumer United States Henderson 42420 South FUR-BO-10001798 Furniture Bookcases Bush Somerset Collection Bookcase 261.9600 2 0.00 41.9136
1 2 CA-2016-152156 08-11-16 11-11-16 Second Class CG-12520 Claire Gute Consumer United States Henderson 42420 South FUR-CH-10000454 Furniture Chairs Hon Deluxe Fabric Upholstered Stacking Chairs,… 731.9400 3 0.00 219.5820
2 3 CA-2016-138688 12-06-16 16-06-16 Second Class DV-13045 Darrin Van Huff Corporate United States Los Angeles 90036 West OFF-LA-10000240 Office Supplies Labels Self-Adhesive Address Labels for Typewriters b… 14.6200 2 0.00 6.8714
3 4 US-2015-108966 11-10-15 18-10-15 Standard Class SO-20335 Sean O’Donnell Consumer United States Fort Lauderdale 33311 South FUR-TA-10000577 Furniture Tables Bretford CR4500 Series Slim Rectangular Table 957.5775 5 0.45 -383.0310
4 5 US-2015-108966 11-10-15 18-10-15 Standard Class SO-20335 Sean O’Donnell Consumer United States Fort Lauderdale 33311 South OFF-ST-10000760 Office Supplies Storage Eldon Fold ‘N Roll Cart System 22.3680 2 0.20 2.5164

5 rows × 21 columns

Let’s say, we want Average Sales, with respect to Category and Segment. We want Segment in Columns and Category in rows.

In Pivot Table function, first argument is Dataset. Here our data is stored in “df”. Second argument is summary variable, here it is “Sales”. Third argument is variable for Rows. Here it is “Category”. Fourth argument is variable for Columns. Here it is “Segment”. And the fifth argument is of aggfunc (aggregate function) in which we can mention how we want to summarize our data like Sum, Average, Count etc.

In [5]:
pd.pivot_table(df, "Sales", "Category", "Segment", aggfunc=np.mean)
Out[5]:
Segment Consumer Corporate Home Office
Category
Furniture 351.347091 354.519792 336.825131
Office Supplies 116.390194 126.745309 115.309021
Technology 427.339534 444.855810 535.976658

Now if we want wan to add Overall Column and Rows at the end. Then we can add argument margins = True. By default, it will have column and row name as “All”. But if we want to give custom name, then we can add an argument margins_name=”Overall_Average”.

In [7]:
pd.pivot_table(df, "Sales", "Category", "Segment", aggfunc=np.mean, margins=True, margins_name="Overall_Average")
Out[7]:
Segment Consumer Corporate Home Office Overall_Average
Category
Furniture 351.347091 354.519792 336.825131 349.834887
Office Supplies 116.390194 126.745309 115.309021 119.324101
Technology 427.339534 444.855810 535.976658 452.709276
Overall_Average 223.733644 233.823300 240.972041 229.858001

Life is not that simple. Sometimes we want another categorical variable in rows or columns to make more eloborative summary of the data. For example, here in this case we want “ship mode” to be added in to the Rows. So how can we do that?

In [8]:
pd.pivot_table(df, "Sales", ["Ship Mode", "Category"], "Segment", aggfunc=np.mean, margins=True, margins_name="Overall_Average")
Out[8]:
Segment Consumer Corporate Home Office Overall_Average
Ship Mode Category
First Class Furniture 304.140366 337.284537 436.845949 338.625452
Office Supplies 105.702875 108.519639 132.224436 111.354186
Technology 409.996201 435.574033 630.233774 463.008608
Same Day Furniture 299.321379 468.189321 251.370680 328.981336
Office Supplies 80.705969 111.253609 91.214531 89.234604
Technology 435.601655 1431.501353 457.541130 613.508827
Second Class Furniture 367.793295 342.176155 401.235600 366.016451
Office Supplies 119.000212 168.844522 147.546401 139.481773
Technology 402.997812 361.315190 396.614145 388.583448
Standard Class Furniture 362.621118 354.782641 297.048209 349.223933
Office Supplies 121.823064 118.208259 105.055419 117.630907
Technology 438.904020 425.982994 565.636707 456.971382
Overall_Average 223.733644 233.823300 240.972041 229.858001

Similarly, if we want to put this in column instead of row. Then we can put it in the third argument.

In [20]:
pd.pivot_table(df, "Sales", "Category", ["Segment", "Ship Mode"], aggfunc=np.mean)
Out[20]:
Segment Consumer Corporate Home Office
Ship Mode First Class Same Day Second Class Standard Class First Class Same Day Second Class Standard Class First Class Same Day Second Class Standard Class
Category
Furniture 304.140366 299.321379 367.793295 362.621118 337.284537 468.189321 342.176155 354.782641 436.845949 251.370680 401.235600 297.048209
Office Supplies 105.702875 80.705969 119.000212 121.823064 108.519639 111.253609 168.844522 118.208259 132.224436 91.214531 147.546401 105.055419
Technology 409.996201 435.601655 402.997812 438.904020 435.574033 1431.501353 361.315190 425.982994 630.233774 457.541130 396.614145 565.636707

Hope this is helpful to you. Please mention you queries to comment box. Also let us know, on which topic you want us to write next blog.

Do you want your data to analyze?

Do you want to organize training on Data Analytics for your team?