
Organizations today collect large volumes of data across operations, quality, customer experience, and workforce performance. While data availability has increased, decision-making often remains unclear. Teams struggle to identify which metrics truly matter and where improvement efforts should focus.
This is where Factor Analysis becomes valuable. It helps organizations simplify complex data and convert it into clear, actionable insight.
Understanding the Challenge of Data Overload
Operational excellence initiatives typically involve tracking multiple KPIs and survey indicators. Individually, these metrics provide information, but collectively they can create confusion.
When too many indicators overlap, leaders face difficulty answering basic questions:
- What are the real drivers of performance?
- Which issues should be addressed first?
- Are different metrics measuring the same underlying problem?
Without clarity, improvement efforts lose direction.
What Is Factor Analysis?
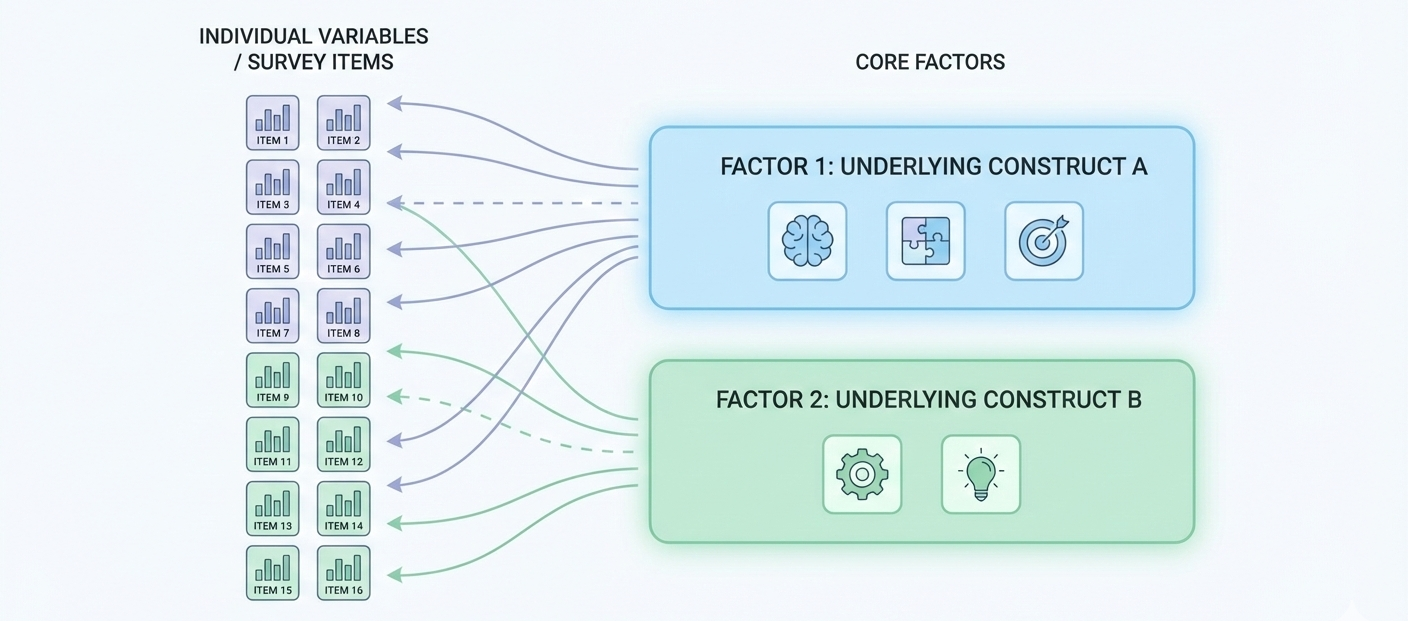
Factor Analysis is a statistical technique used to identify underlying factors that explain patterns among a large number of related variables.
Instead of analyzing each variable separately, it groups related measures into a smaller number of meaningful factors. These factors represent the core dimensions influencing performance. In simple terms, Factor Analysis helps organizations move from many indicators to a few clear drivers.
How Factor Analysis Creates Operational Clarity
Example: Manufacturing Operations
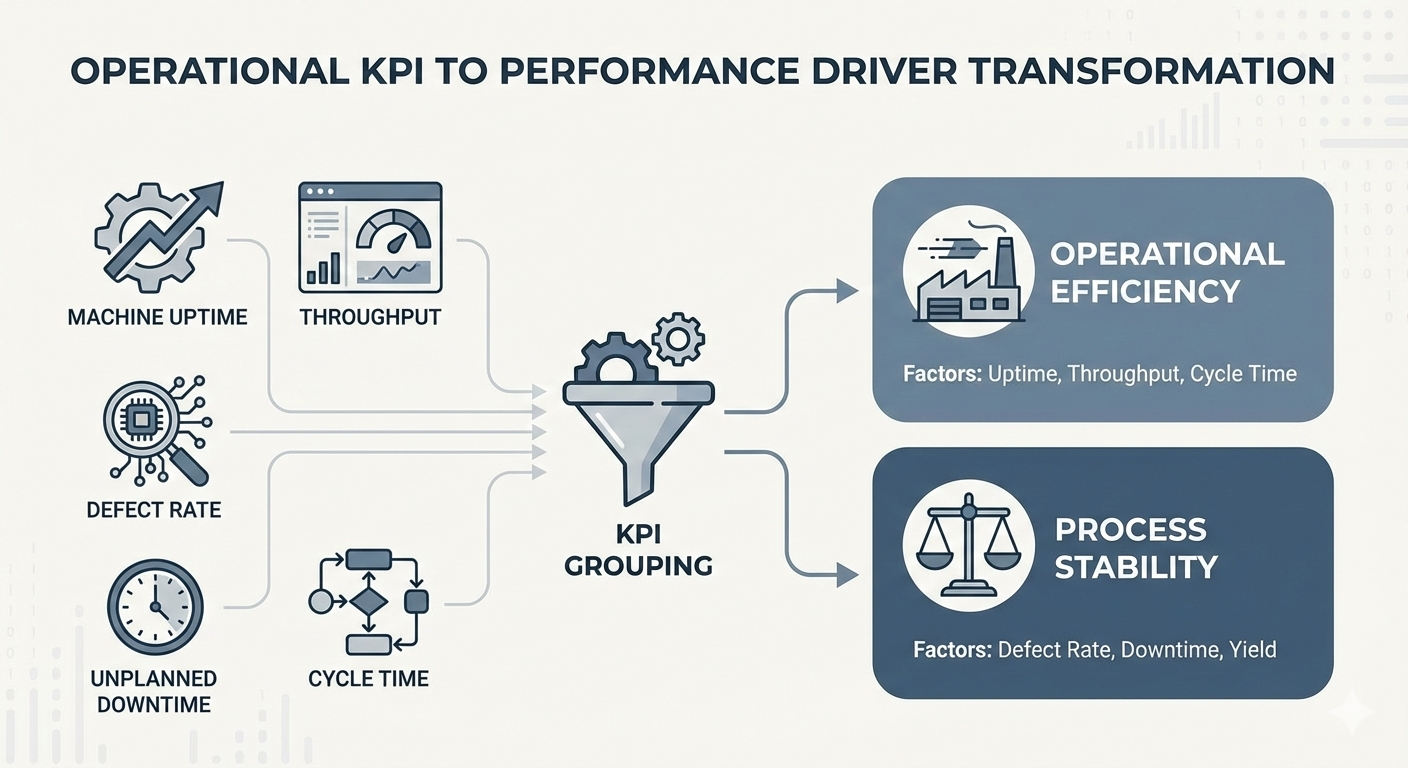
A manufacturing team tracks machine downtime, cycle time, operator availability, scrap rate, and rework percentage. While all metrics are important, analyzing them individually can dilute focus.
Factor Analysis may reveal two key factors:
- Operational Efficiency
- Process Quality Stability
This allows leadership to prioritize improvement initiatives more effectively and align resources with strategic goals.
Example: Customer Experience Management
Service organizations often measure response time, staff behaviour, communication clarity, and issue resolution. Factor Analysis groups these measures into broader dimensions such as service responsiveness and service quality.
This enables management to design targeted service improvement strategies instead of reacting to isolated feedback points.
Real-World Case Study: Applying Factor Analysis in SPSS to Student Stress Data
This section demonstrates how Factor Analysis can be applied to real-world survey data using SPSS. The aim is to show how multiple related stress indicators can be reduced into a smaller set of meaningful factors that are easier to understand and use for decision-making.
Data Source
The dataset used in this case study was obtained from Kaggle and is publicly available for learning and analytical practice. It contains anonymized responses from 1,100 students and includes psychological, academic, social, physical, and environmental stress-related variables measured on Likert-type scales.
The dataset was chosen because it reflects real-world complexity, where many variables measure overlapping aspects of stress—making it ideal for Exploratory Factor Analysis.
Objective of the Analysis
The objective of applying Factor Analysis was to:
- Identify underlying stress dimensions
- Reduce a large number of correlated variables
- Improve interpretability of survey results
- Demonstrate a practical SPSS workflow for beginners
Step-by-Step: How to Perform Factor Analysis in SPSS
Step 1: Prepare the Data
- Open the dataset in SPSS
- Ensure all selected variables are numeric
- Set the Measurement Level = Scale
- Exclude outcome variables (such as overall stress level)
This ensures that SPSS treats the variables appropriately for correlation-based analysis.
Step 2: Open Factor Analysis

Move all relevant stress-related variables into the Variables box.
Step 3: Check Data Suitability
- KMO and Bartlett’s Test
These tests verify whether Factor Analysis is appropriate for the dataset.
Step 4: Choose Extraction Method
- Method: Principal Components
- Matrix: Correlation
- Scree Plot
- Specify the number of factors (based on interpretation needs)
Step 5: Apply Rotation
- Varimax
- Kaiser Normalization
Rotation improves clarity by making factor loadings easier to interpret.
Step 6: Run the Analysis
Interpretation of SPSS Output
The dataset showed excellent suitability for Factor Analysis, with a Kaiser–Meyer–Olkin (KMO) value of 0.957 and a statistically significant Bartlett’s Test. This confirms that the variables were sufficiently correlated for meaningful factor extraction.
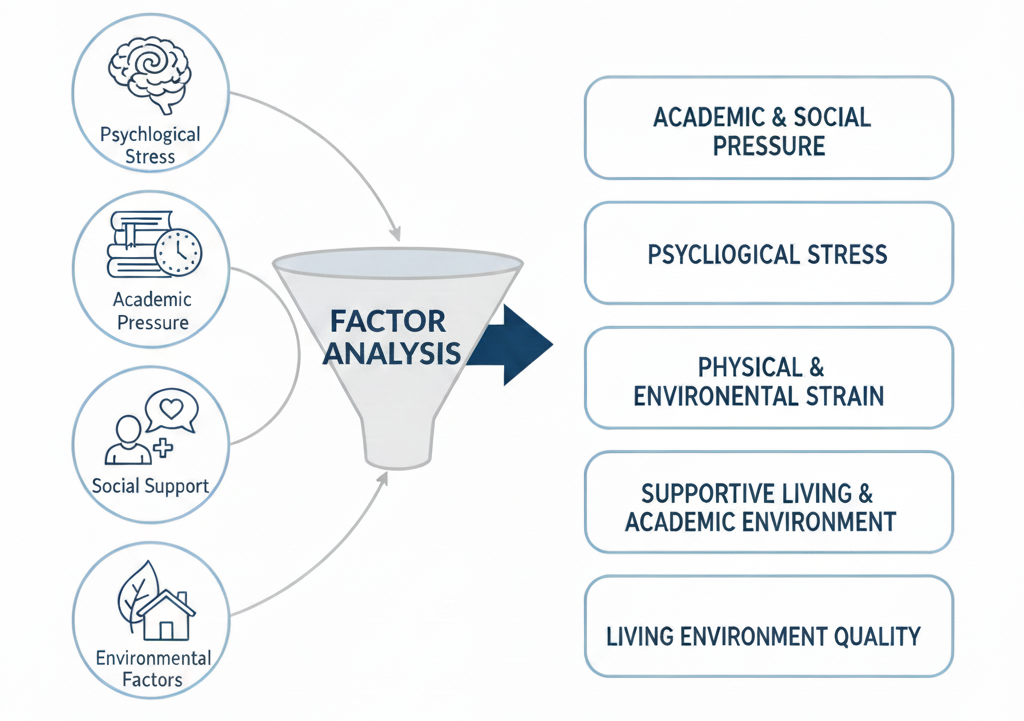
The analysis resulted in a five-factor solution, explaining approximately 76% of the total variance. This indicates that most of the information contained in the original stress indicators was retained while significantly reducing complexity.
Examination of the rotated factor structure revealed five meaningful stress dimensions, including academic and social performance pressure, psychological stress, physical and environmental strain, supportive living and academic environment, and living environment quality.
Rather than interpreting many overlapping indicators individually, the factor structure provided a simplified and clearer view of the key drivers influencing student stress.
Connecting the Case Study to Operational Excellence
While this example uses survey data, the same Factor Analysis approach is widely applied in operational excellence initiatives such as KPI rationalization, employee engagement analysis, and service quality improvement. These results illustrate how Factor Analysis moves beyond statistics to support clearer and more focused decision-making.
Why Factor Analysis Supports Better Decisions
When applied correctly, Factor Analysis:
- Reduces complexity in reporting
- Eliminates redundant KPIs
- Improves dashboard clarity
- Helps prioritize improvement actions
- Aligns analytics with operational strategy
It bridges the gap between data science and operational execution.
What Factor Analysis Does Not Do
It is important to set realistic expectations.
Factor Analysis does not:
- Predict future outcomes
- Establish cause-and-effect relationships
- Replace business judgment or domain expertise
It identifies structure and relationships within data. Interpretation and action remain human responsibilities.
Best Practices for Using Factor Analysis
To gain maximum value:
- Apply it to related variables or survey data
- Combine statistical results with operational knowledge
- Use business-friendly language when naming factors
- Focus on simplifying insights, not increasing complexity
Common Mistakes to Avoid
Organizations often reduce Factor Analysis to a technical exercise. Common mistakes include:
- Blindly accepting software output
- Using unrelated variables
- Creating too many factors
- Ignoring business context
Clarity comes from understanding, not automation.
When Factor Analysis Is Most Useful
Factor Analysis works best when:
- KPIs overlap and create confusion
- Survey results are difficult to interpret
- Leadership needs structured insight
- Improvement priorities are unclear
It is less suitable when variables are independent or when prediction is the primary objective.

Conclusion
Operational excellence is not about measuring everything. It is about understanding what truly drives performance.
Factor Analysis helps organizations cut through data complexity, focus on core drivers, and support better, faster, and more confident decisions.
When analytics delivers clarity, operational excellence becomes achievable.
Written by
Manshi Gorasiya
Data Science Intern
Stat Modeller