
Local Time
- Timezone: Asia/Kolkata
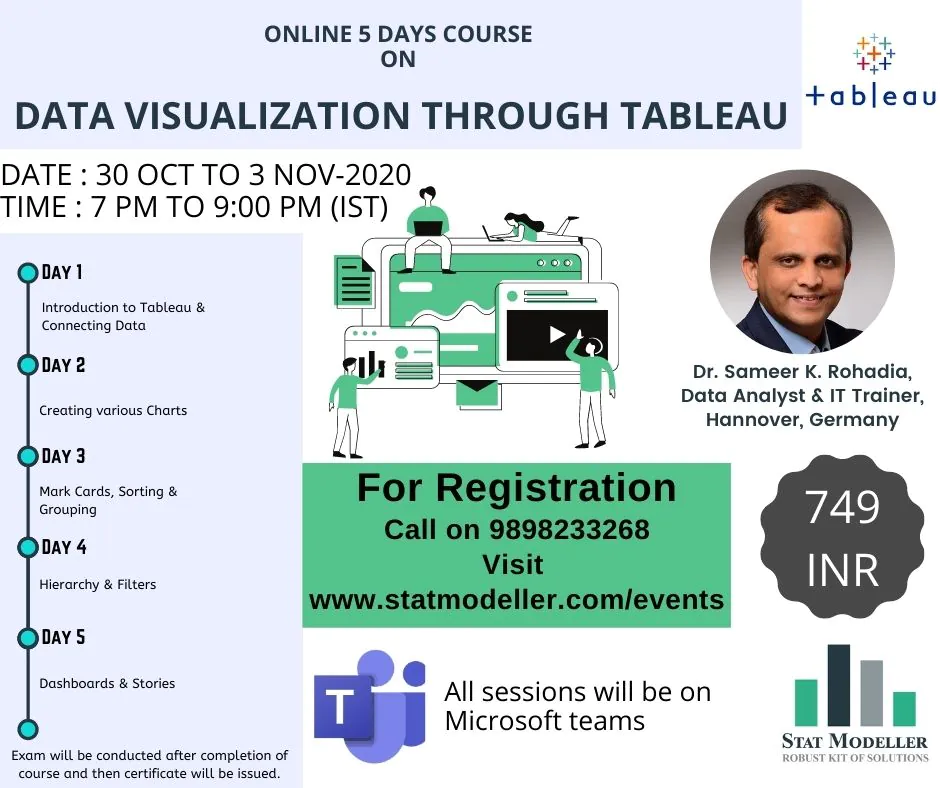
- Date: Oct 30 2020 - Nov 03 2020
- Time: 7:00 pm - 9:00 pm
Data Visualization through Tableau
About this Webinar
Plenty of data is generated every second. Now the challenge is how to manage that huge data and convert them into some meaningful business insights.
Tableau can help anyone see and understand their data. Connect to almost any database, drag and drop to create visualizations, and share with a click.
To develop proficiency in handling large data and convert then into decision making using tableau, Stat Modeller has organized 5 days online workshop on Tableau.
Schedule
- Date: 30th October to 3rd November 2020
- Timing: 7:00 PM to 9:00 PM (IST)
Benefits
- Perfectly Suitable for Beginners
- Experienced faculty
- Hands-on experience
- Soft-copy of Material
- Email support after training
- E-Certificate
Register Now
Content
-
- Introduction to Tableau
- What is Data Visualization?
- Benefits of Data Visualization
- Why Tableau?
- Fundamentals of Tableau
- Introduction to Course
- Course Outline
- Methodology
- Set up of Tableau Desktop/Public
- Download and Installation
- User Interface of Tableau
- Let’s get familiar with UI
- Import Data from different Sources
- Import from various data sources like Excel, CSV, Text, etc.
- Live Vs Extract
- Tableau Charts
- Different types of Charts and its usage
- Mark Cards, Sorting & Grouping
- Using Size, Color, Label, Tooltip, Shapes & Detail
- Various Sorting & Grouping
- Hierarchies & Filters
- Drill Down & Hierarchies
- Various Filters
- Dashboards & Stories
- Introduction to Dashboard
- Creating Story Points
- Exam
- Introduction to Tableau
Register Now
Hourly Schedule
Day 1
- 7:00 PM -
- 9:00 PM
- Introduction to Tableau & Connecting Data
Day 2
- 7:00 PM -
- 9:00 PM
- Creating various Charts
Day 3
- 7:00 PM -
- 9:00 PM
- Mark Cards, Sorting & Grouping
Day 4
- 7:00 PM -
- 9:00 PM
- Hierarchy & Filters
Day 5
- 7:00 PM -
- 9:00 PM
- Dashboards & Stories